Amazon CloudWatch
Amazon CloudWatch (AWS) is a monitoring service from AWS that helps you observe your applications and infrastructure resources. Montplex Cache provides integration, allowing you to include Montplex Cache service data in Amazon CloudWatch metrics and logs.
Create Data Source
- Visit https://console.aws.amazon.com/cloudwatch/ to open the CloudWatch console.
- Select the Region for creating the data source.
- In the navigation pane, select Settings.
- Select the Metrics data sources tab.
- Choose Create data source.
- Select the desired source, Prometheus, then click Next.
- Enter the data source's name.
This name must match the Montplex Cache Resource Monitor name. In the Update Data Source section, you will update the Dashboard's Metrics JSON file, and the name needs to match the LAMBDA call name in the JSON. Example: us-east-1-eks
-
Enter the required information based on the selected data source.
Endpoint should be the monitoring address URL exposed by Montplex Cache. User/Password should be the monitoring user/password information exposed by Montplex Cache.
-
For the VPC option, select Do not use VPC.
-
Confirm the creation of IAM resources by AWS CloudFormation, which is the Lambda function execution role.
-
Choose Create data source.
Create Dashboard
- visit https://console.aws.amazon.com/cloudwatch/ to open the CloudWatch console.
- In the navigation pane, select Dashboards, then choose Create dashboard.
- In the Create new dashboard dialog, enter the dashboard's name, then select Create dashboard.
It is recommended to use a name consistent with the Montplex Cache running environment cluster name for easy identification.
- Choose Save dashboard.
Update Data Source
- Select the target Resource Monitor in Montplex Cache and copy the exposed Metrics JSON.
- Visit https://console.aws.amazon.com/cloudwatch/ to open the CloudWatch console.
- In the navigation pane, select Dashboards and click the Dashboard that needs the data source update.
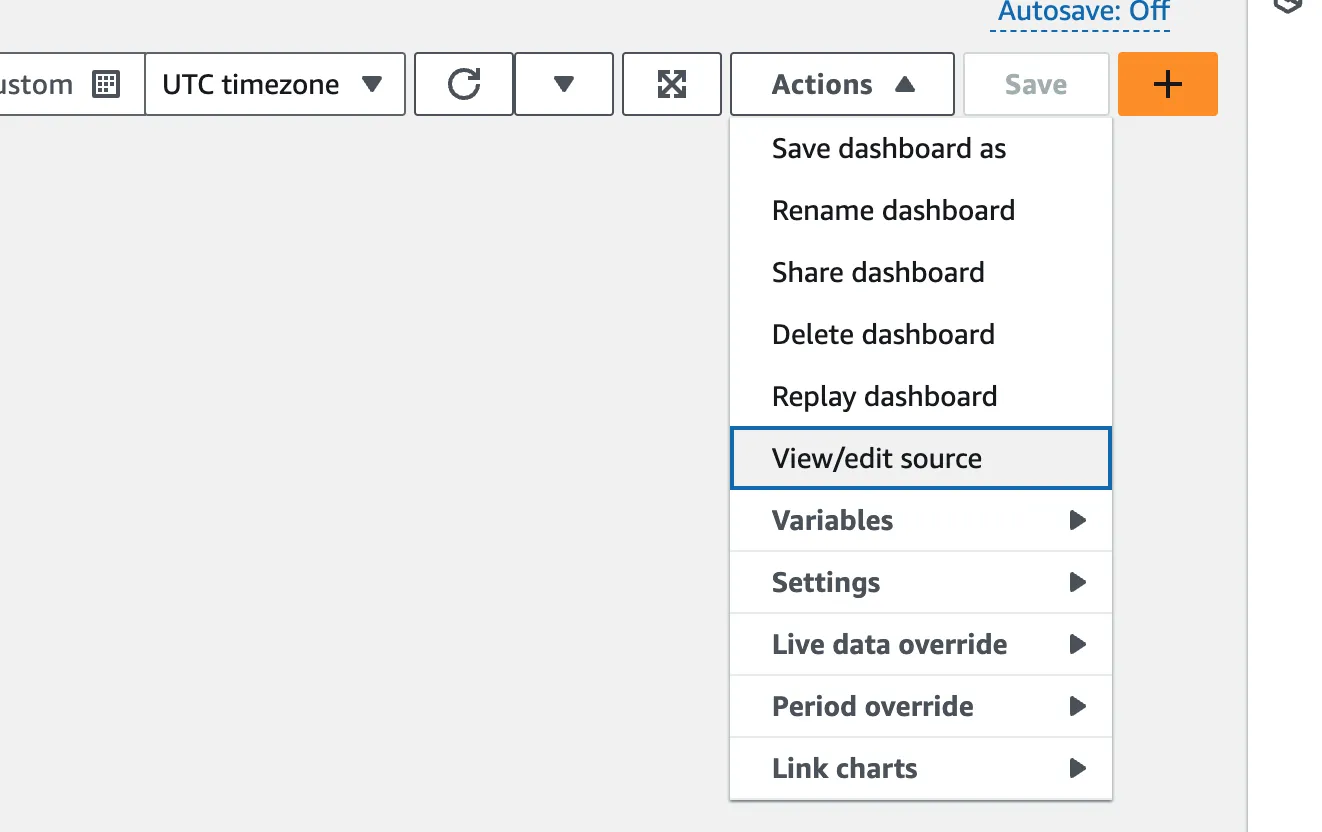
- Choose View/edit source from the Actions dropdown list.

- Paste the copied JSON content into the editor and select Save dashboard.
- The data source name in the JSON must match the data source name created in CloudWatch.
- The Region should match the region where the data source was created.
Custom Widgets
- On the dashboard page, select Add widget.
- In the Add to this dashboard dialog, perform one of the following actions:
- To add a chart to the dashboard, select Line or Stacked area, then choose Configure. In the Add metric graph dialog, select the metrics to graph, then choose Create widget.
- To add a number displaying metrics to the dashboard, select Number, then choose Configure. In the Add metric graph dialog, select the metrics to graph, then choose Create widget.
- To add a text block to the dashboard, select Text, then choose Configure. In the New text widget dialog, format the text using Markdown, then choose Create widget.
- (Optional) Select Add widget and repeat step 2 to add another widget to the dashboard. You can repeat this step multiple times.
For each chart on the dashboard, there is an information icon in the upper right corner. Selecting this icon will display a description of the metrics in the chart.